
Letters to Washington
- B C M
- Jan 31, 2011
- 10 min read
Updated: Apr 18, 2021
by Victor K. Lai, CFA
Y = C + I + G + [E – M]
Some might remember the common equation for GDP: Gross Domestic Product = Consumption + Investment + Government Spending + Net Exports. GDP represents the total value of goods and services produced by a country. Growth in GDP is commonly used as a measure of a country’s economic health and can provide insight to the general welfare of a nation. Recently, the United States experienced one of the worst periods of GDP growth in its history. In this letter we look at what America has done in response and what the implications may be moving forward.
Easy money
For most developed economies, the largest component of GDP is Consumption, usually somewhere around 60% – 70%. Figure 1 shows the breakdown of US GDP as of 2010.
Figure 1

While consumption isn’t bad in of itself, the characteristics of American consumption arguably were. Over recent decades, consumption in the US was fueled by increasing amounts of borrowing. Figure 2 shows the growth of total US debt outstanding from 1940- 2010 as reported by the US Federal Reserve (shaded areas represent recessions).
Figure 2

Clearly, this growth in debt was unsustainable and ultimately it ended with the financial crisis of 2007. As the easy credit that fueled earlier expansion evaporated, the US economy came to a virtual standstill – who came to rescue?
Enter the G
In response, the US Government has implemented unprecedented fiscal stimulus in hopes of spending its way out an economic rut. In addition to trillions of dollars already committed to various stimulus and bailout packages, the government forecasts it will run additional trillion dollar deficits for the next decade. Figure 3 shows the projected deficits through 2020 according to government projections.
Figure3

It’s hard to argue that injecting trillions of dollars into the economy won’t be short-term accretive to GDP (and in fact it has been), but what about the long-term effects? We can evaluate this by considering how stimulus is funded. The government can typically draw from two sources, taxes and borrowing. Since tax receipts are lower when GDP is depressed (there is less income to tax), the US government has borrowed to fund the stimulus. As a result, the ratio of federal debt to GDP has risen to levels not seen since the 1940’s (which were high due to WWII efforts).
Figure 4

Skeletons in the debt closet
Most Americans were unaware of the problems that excessive debt created pre - 2007. Moving forward, they should recognize the skeletons hiding in the government’s debt closet. Currently, outstanding federal debt is estimated to be about $12 trillion (not counting unfunded commitments and obligations). Fortunately, the government faces favorable interest rates. For example, the yield on 10 year Treasuries (government issued debt) has been hovering around 3%. However, as Figure 5 shows, 10 year Treasury rates are abnormally low. In fact, they have to double just to revert to long-term average levels.
Figure 5

A rise in interest rates would obviously syphon public resources away from productive use. But there are less obvious issues as well. Classical economics tells us that private investment (the “I” in the GDP equation) is the most efficient driver of production, employment, and ultimately GDP. In other words, current private investment is the most efficient way to increase future economic growth. That investment must be funded by savings.
However, if the need to fund government debt soaks up all the savings, then the “I” can get crowded out of the GDP equation. This isn’t to say government debt is always bad. That judgment has much to do with how debt proceeds are used. For example, there are social investments that only the government can realistically make. Taking on debt to fund such investments can benefit society as a whole.
Unfortunately, our government seems to have emphasized short-term stimulus programs such as cash for clunkers, cash for appliances, home buying incentives, and so forth. As the National Bureau of Economic Research has pointed out, this type of government spending has no long-term benefit for GDP. Certainly, it will boost the economy in the short-term. But as Dr. Robert Barro (Economics Professor at Harvard) has pointed out, stimulus of this nature has no multiplier effect.
In other words, offering incentives to buy cars may increase GDP today, but it creates no mechanism for increasing GDP tomorrow. In fact, it simply pushes the car purchases (which would have been made anyway) forward without accounting for how to repay the debt issued to buy the cars. Figure 5 shows how the benefit of deficit driven government stimulus flattens out as it increases.
Figure 6

As deficit funded stimulus increases, so does the need for financing the associated debts. At some point, the increase in financing costs will offset the benefit of the stimulus. And if the stimulus does not create the growth needed to offset the costs, then the government may need to raise taxes to cover them.
Adding insult to injury, Dr. Christina Romer (Economics Professor at UC Berkeley) has shown that taxes can have a multiplier effect of 3x. This means an increase of 1% in taxes could decrease GDP by 3%. Lower GDP will lower tax revenues, and as tax receipts falter, the irony is that the government may need to issue even more debt.
The circumstances described aren’t promising for long-term GDP growth. Of course that doesn’t mean GDP can’t continue to expand short-term. In fact, GDP has already bounced off its 2009 lows. However, the point is to keep our eyes on the bigger picture. Unless US fiscal strategy is changed, it’s unlikely that growth of any kind (short or long-term) will be sustained.
Implications for equity investors
Depending who you ask, US stocks can seem cheap or expensive. Regardless of which camp you follow, it’s important to understand the argument and the facts behind it. Many of the statistics that get thrown around as “facts” are just misunderstood and incorrectly interpreted.
For example, Wall Street has made a lot of noise about cheap US stock valuations -- quoting Price to Earnings ratios of 13x and 12x. That does look attractive relative to the long-term average of 16x. The problem is the comparison isn’t right because the 13x multiple is based on consensus expected forward operating earnings.
As Dr. John Hussman (President of Hussman Econometrics Advisors) has pointed out, this poses a couple of material concerns. First, expectations are often wrong. For example, based on data from Standard and Poor’s, about 70% of S&P 500 reported company earnings beat consensus analyst expectations in 2010.
Second, companies can manipulate operating earnings by managing what they classify as normal operating items. Operating earnings measures such as EBITDA (earnings before certain expenses) are not even recognized by US GAAP (Generally Accepted Accounting Principles). To say the least, forward operating earnings may be prone to some serious errors.
An alternative is to use reported earnings (bottom line earnings) as they are more difficult to manipulate. In fact, the 16x long-term average P/E often quoted is based on trailing twelve months of reported earnings. So in effect, the 13x vs 16x argument is comparing two different P/E metrics (forward versus trailing).
The point is, if you’re going to compare, make sure it’s an apples to apples comparison Regardless of which earnings you use, it can also help to normalize them (or average them over several years) to smooth out extremities that may occur in the business cycle.
Based on seven years of normalized reported earnings, the S&P 500 is currently valued at over 20x. This is well above the long-term average of 16x and implies that stocks may not be as cheap as Wall Street expects. Of course 20x isn’t unreasonable – remember that P/E ratios passed 40x during the technology bubble. Also markets are notoriously difficult to time and “can remain irrational longer than you can remain solvent” (hat tip to the late, great John Maynard Keynes).
The takeaway is stocks currently don’t appear as extremely cheap or expensive as some make them out to be. And even if they were, trying to time peaks and bottoms can be more risky than rewarding. As such, prudent investors would be well-advised not to make any sudden or extreme movements (such as jumping entirely into cash). The prudent approach is to maintain a balanced allocation appropriate for your circumstance. After all there’s not a wrong time for the right allocation.
A note on alternatives
I planned on limiting this letter to US equities, but given the outright fervor surrounding gold, it seems necessary to write something on the topic. Gold prices went up 165% from 2005 - 2010. That is an average annual return of 28%, shown by the price appreciation of the GLD ETF below.
Figure 7

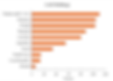
What kind of investment can maintain that kind of growth indefinitely? In 2006 many investors would have said real estate, and today the same investors are likely saying gold. The truth is that the long-term annualized growth in gold prices has been around 5%. Though gold may certainly continue to post double digit returns, I see little fundamental reasons for it. In my opinion, further price appreciation would be speculative. As a reference point, just look at what the biggest speculators are doing. The notorious hedge fund manager John Paulson started a gold fund in 2009. Shortly after, he was holding more gold than the countries of Brazil, South Korea, the Czech Republic, and Ireland combined (Figure 8).
Figure 8
What in the world is a hedge fund manager doing with all that gold? I would think he is probably speculating. And as speculators like to do, Paulson will probably try selling at the top (caveat emptor).
On the flip side, I think one of the most attractive domestic investment opportunities is also one of the most detested – real estate. On average, nationwide real estate prices fell as much as 45% from the peak in 2007. Regardless of the investment, there is only one way to make money – buy low and sell high. While real estate prices may not have found a definitive bottom, it is hard to argue that prices are still high. Figure 10 shows average US commercial real estate prices from 2001 - 2010
Figure 9

In addition to attractive prices, interest rates are also at historic lows. This gives investors the uncommon opportunity to buy low with cheap leverage - a combination that is not likely to last. Yes, I recognize that debt is what got us into trouble in the first place. However, just as the worst time to lever up is at cyclical highs (when there is the most downside), the best time to lever up is at cyclical lows (when there is the most upside). One consideration to keep in mind is that real estate cycles move slowly. It may take many years for investors to realize gains. As such it is not appropriate for short term or impatient investors.
Summing Up
All forecasts are fraught with uncertainty, and I’ve made many forecasts in this letter. One thing, however, is certain. The fate of our economy has as much to do with politics as with finances. The government’s willingness and ability to reverse the trajectory of Debt/GDP will be crucial to this nation’s long-term economic well-being. I’m no economist, but there’s no mystery about how to do this.
First, the government simply must not run a decade’s worth of trillion dollar deficits. And if it is going to spend, it should focus on productive spending. Spending on education, for example, is productive. Spending one dollar to bail out a defunct company so that it can destroy two more dollars serves no particularly productive purpose that I can see.
Second, the government must promote sustainable real economic growth. Economic growth is the tide that lifts (or lowers) us all. For individuals, higher GDP means more jobs and better standards of living. For the government, higher GDP increases tax collections, which provides more resources to govern with.
Despite the countless letters written to Washington DC by concerned citizens, public policies don’t seem to be improving just yet. While Washington can disregard our letters all it wants, perhaps it should take a second look at the letters that make up GDP. Because it seems everyone in DC has forgotten about the fundamental drivers of our economy.
While President Obama’s recent State of the Union address offered some hope for improving future policies, actions speak louder than words. Until the government actually changes how it manages and allocates public resources, future economic growth remains at risk. Keep in mind that this is an outlook on long-term trend growth. It is not to say that the economy cannot expand over the short-term due to things like “cash for clunkers.” But it’s the long-term sustainability of that growth which I’m addressing.
All things considered, it’s still the right time for prudent investors to maintain a properly diversified allocation appropriate for their needs and goals. That being said, gold prices look dangerously expensive. While hard assets like precious metals have a place in properly diversified portfolios, I see little reason for taking a large, speculative position at current prices. Real estate appears to be the most attractive domestic investment opportunity. Low prices and the ability to leverage at low interest rates create the potential for attractive long-term returns.
Thank you for reading. I hope you found our time together to be useful or at least informative. If you or anyone you know would like help with investing, please do not hesitate to contact BCM.
Be Great,
Victor K. Lai, CFA
Bellwether Capital Management LLC (BCM) is a registered investment adviser (RIA). It provides investment management and consulting services for people and organizations. Please visit www.bellwethercm.com to learn more.
Disclosures
This is for informational purposes only. None of this information constitutes advice. None of this information constitutes an offer to buy or sell any financial product or service. Bellwether Capital Management LLC and its representatives do not provide tax, legal, or insurance advice; you should consult with the appropriate professional advisors for any matters related to those areas. Investors should understand that investing is inherently risky and it comes with the potential for principal loss. Performance cannot be guaranteed, there is no guarantee that an investor’s objectives will be met, and past results are no guarantee of future events. While this information is believed to be accurate, its accuracy cannot be guaranteed. The availability of investment products and services may differ based on jurisdiction. Everything herein is subject to Copyright by Bellwether Capital Management LLC. Unauthorized reproduction of this content in any part is strictly prohibited. You acknowledge that you have read, understand, and abide by these disclosures. In addition, you release Bellwether Capital Management LLC and any of its employees, representatives, affiliates, or other related parties from any liabilities related to using this information.